





© 2026 Gliese Tech Limited (EdWealth). All rights reserved.
MoneyBench: measuring usefulness and factual accuracy on real money questions
EdWealth Research · Aug 2026
Three studies, May to July 2026, under human blind scoring and internet-verified automated scoring. Published by EdWealth Research, August 2026.
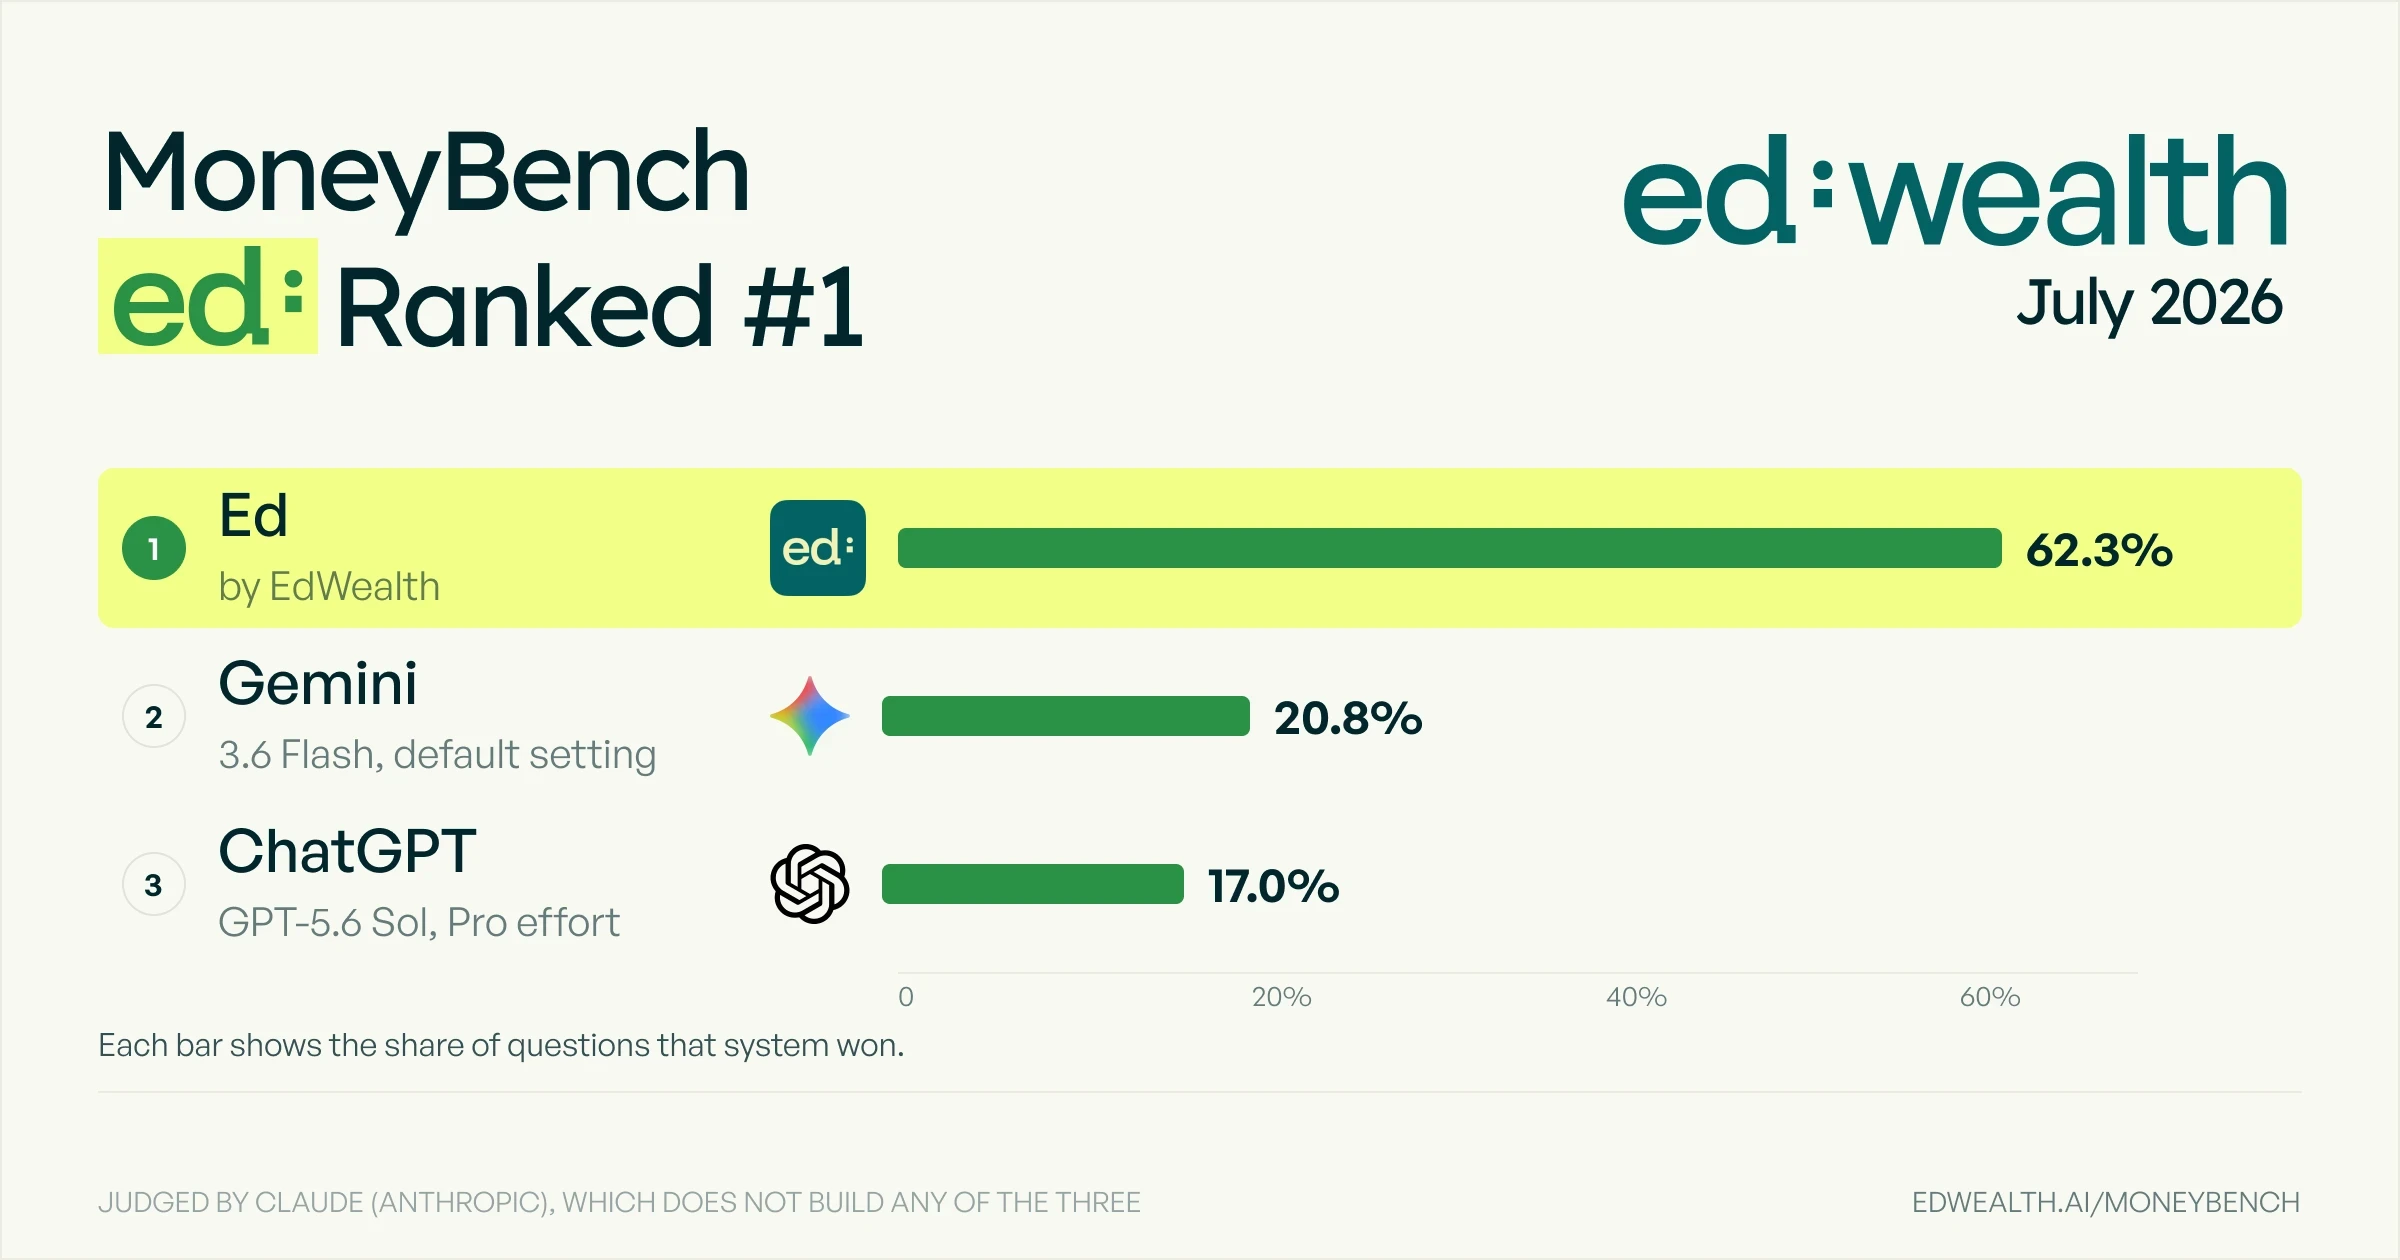
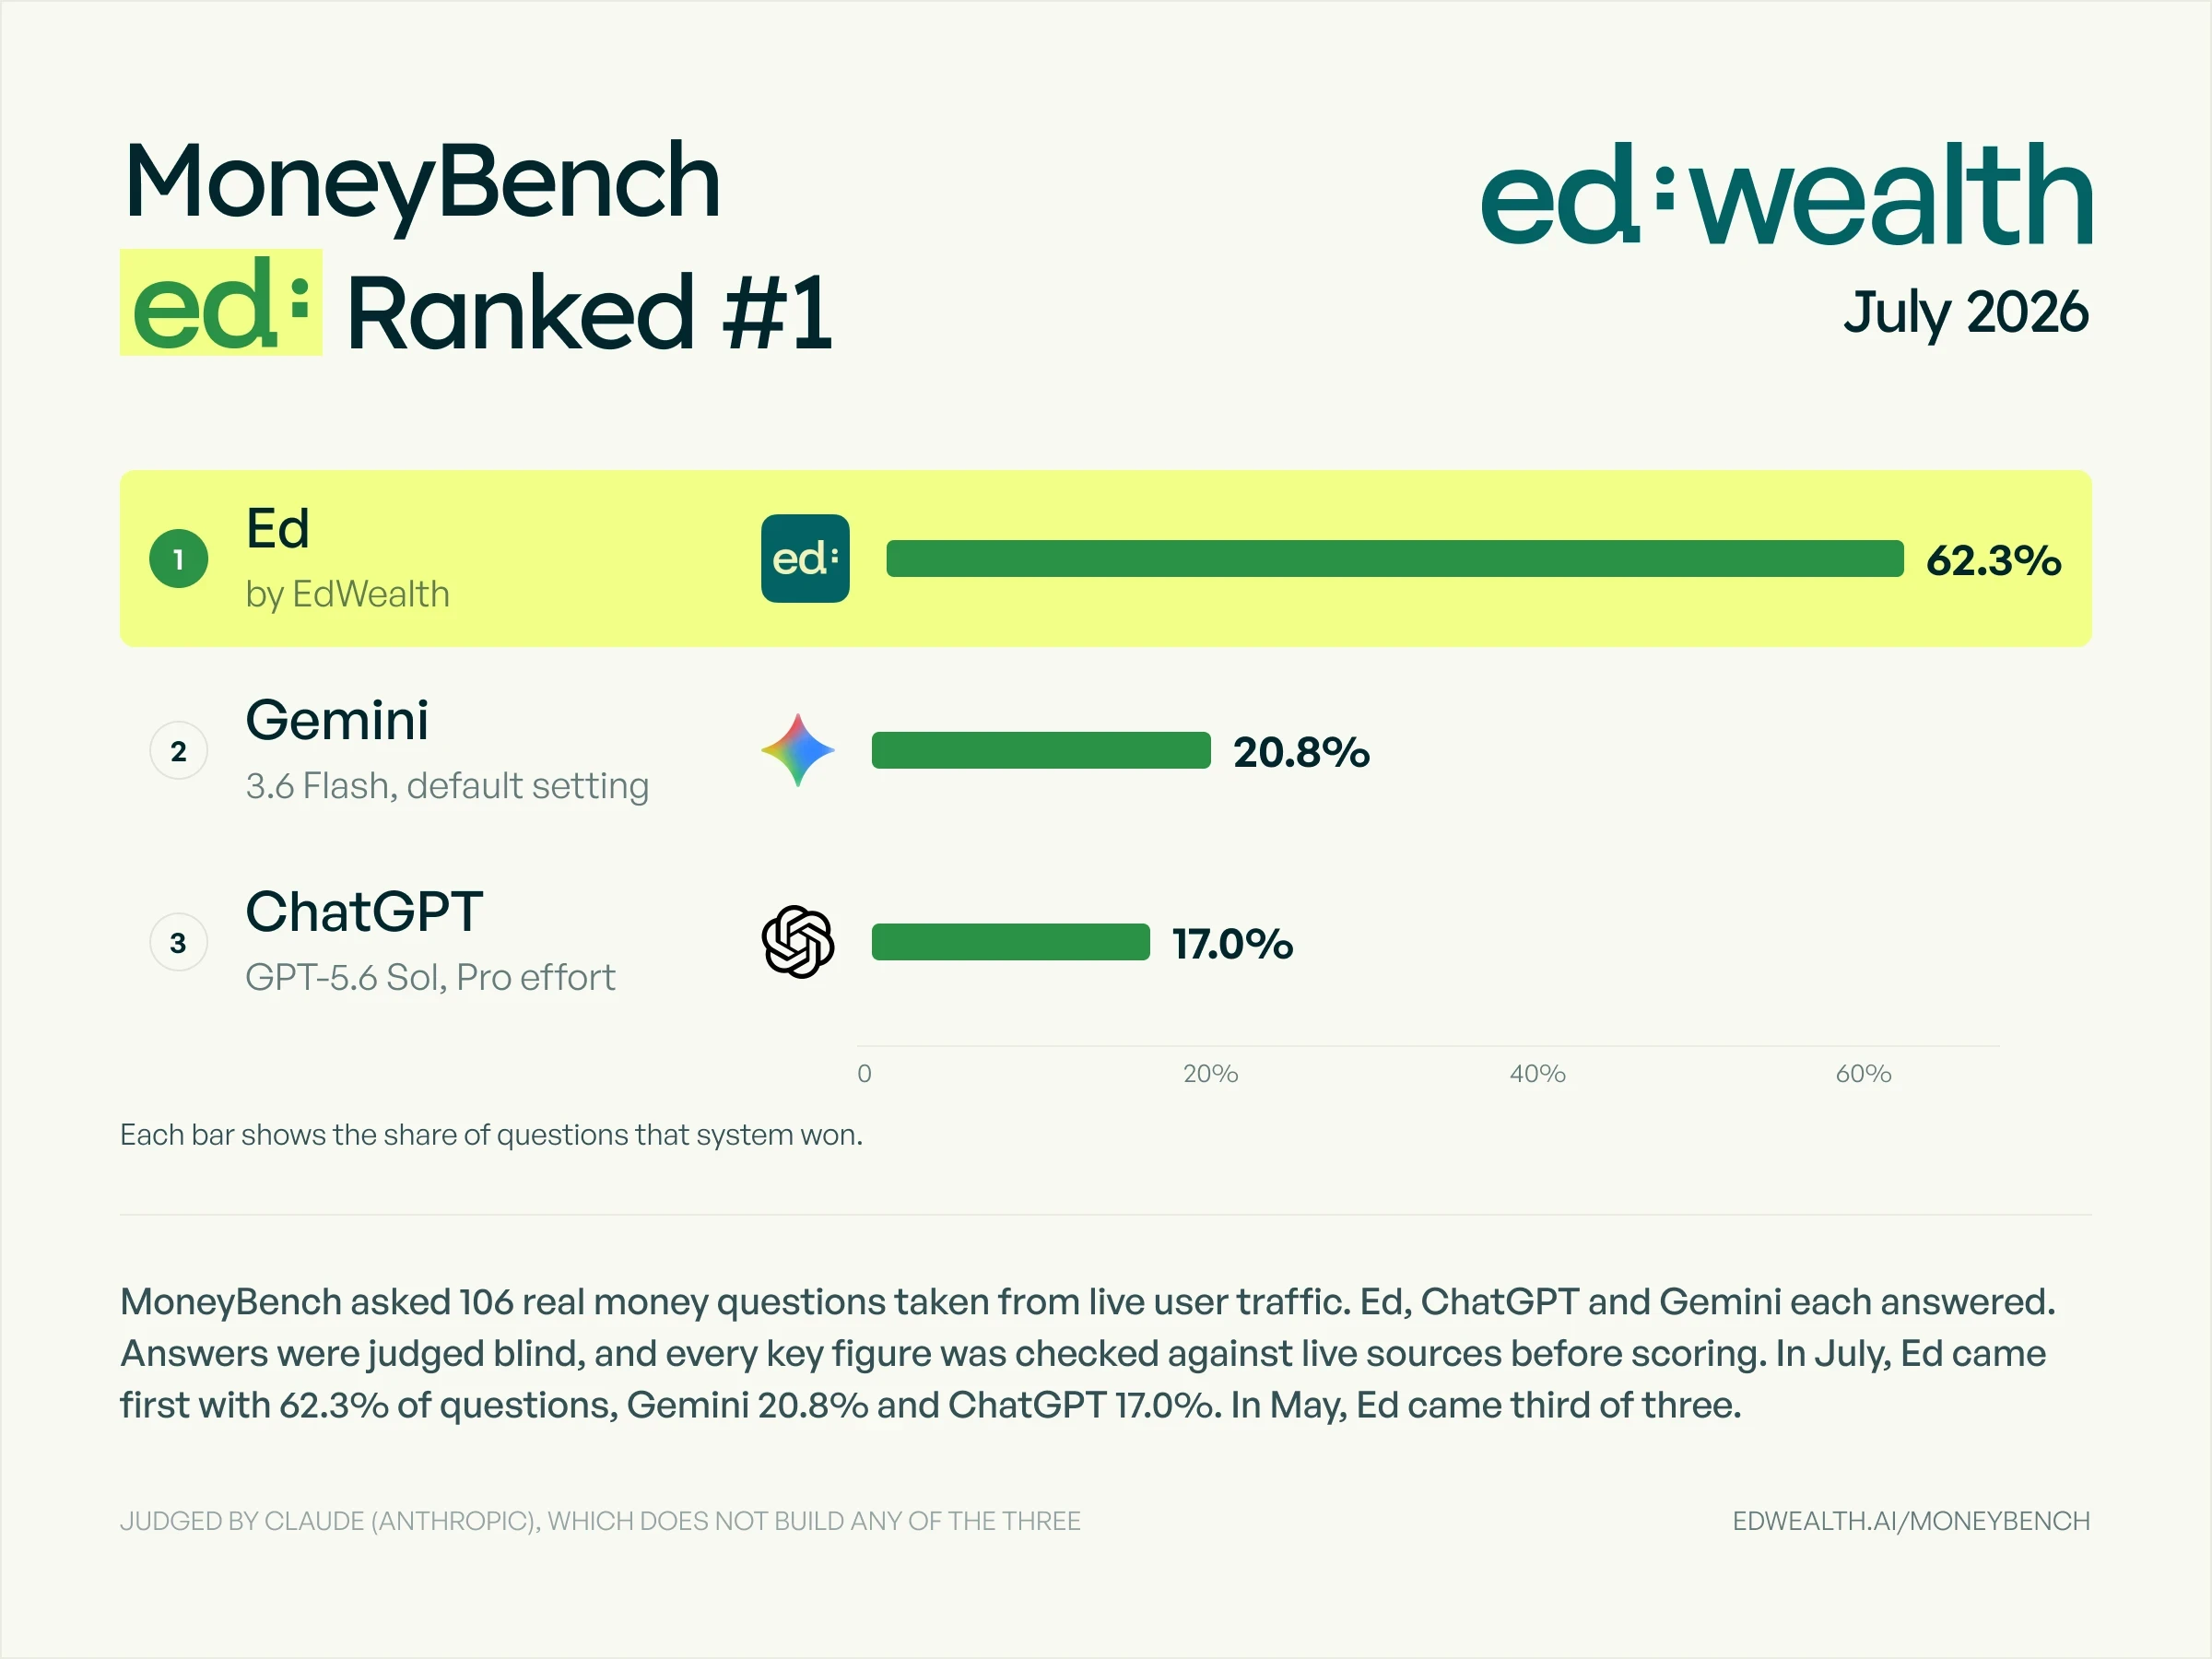
Abstract. Three studies on real user money questions, May to July 2026, found that what separates AI assistants in this domain is usefulness, not accuracy alone and not prose. Ed, a finance-specific assistant, ran against ChatGPT and Gemini in all three studies. It ended the series first at 62.3%, against Gemini at 20.8% and ChatGPT at 17.0% (95% CI on Ed's share [52.8%, 71.7%]), under a judge from outside every system's model family that verified key facts in each answer against live sources; the result survived a verification pass that moved Ed's own score down 5.3 points and both comparators up. The series began with a loss: in May, Ed placed last of three at 17.4% across 1,308 blind votes; the same study located the gap in delivery rather than capability (§1), and the engineering between studies targeted it. In June, a blind panel of 25 human scorers placed Ed first at 54.4% of 375 votes. Scored on accuracy alone, the three systems are near chance-level apart (§3.5). The studies are related tests rather than one trajectory, and §5 states the single cross-study comparison the series supports. The evidence supports the hypothesis that a system built for one domain outperforms general assistants inside it, and does not extend beyond that.
Disclosure. EdWealth publishes this report and builds Ed. Countermeasures are described in §2: blind presentation in the human panels, anonymised and position-randomised presentation to the automated judge (§6), a judge drawn from outside all three vendors and outside the model family of every system under test, Ed's included, per-question fact verification, and publication of losses alongside wins.
Findings
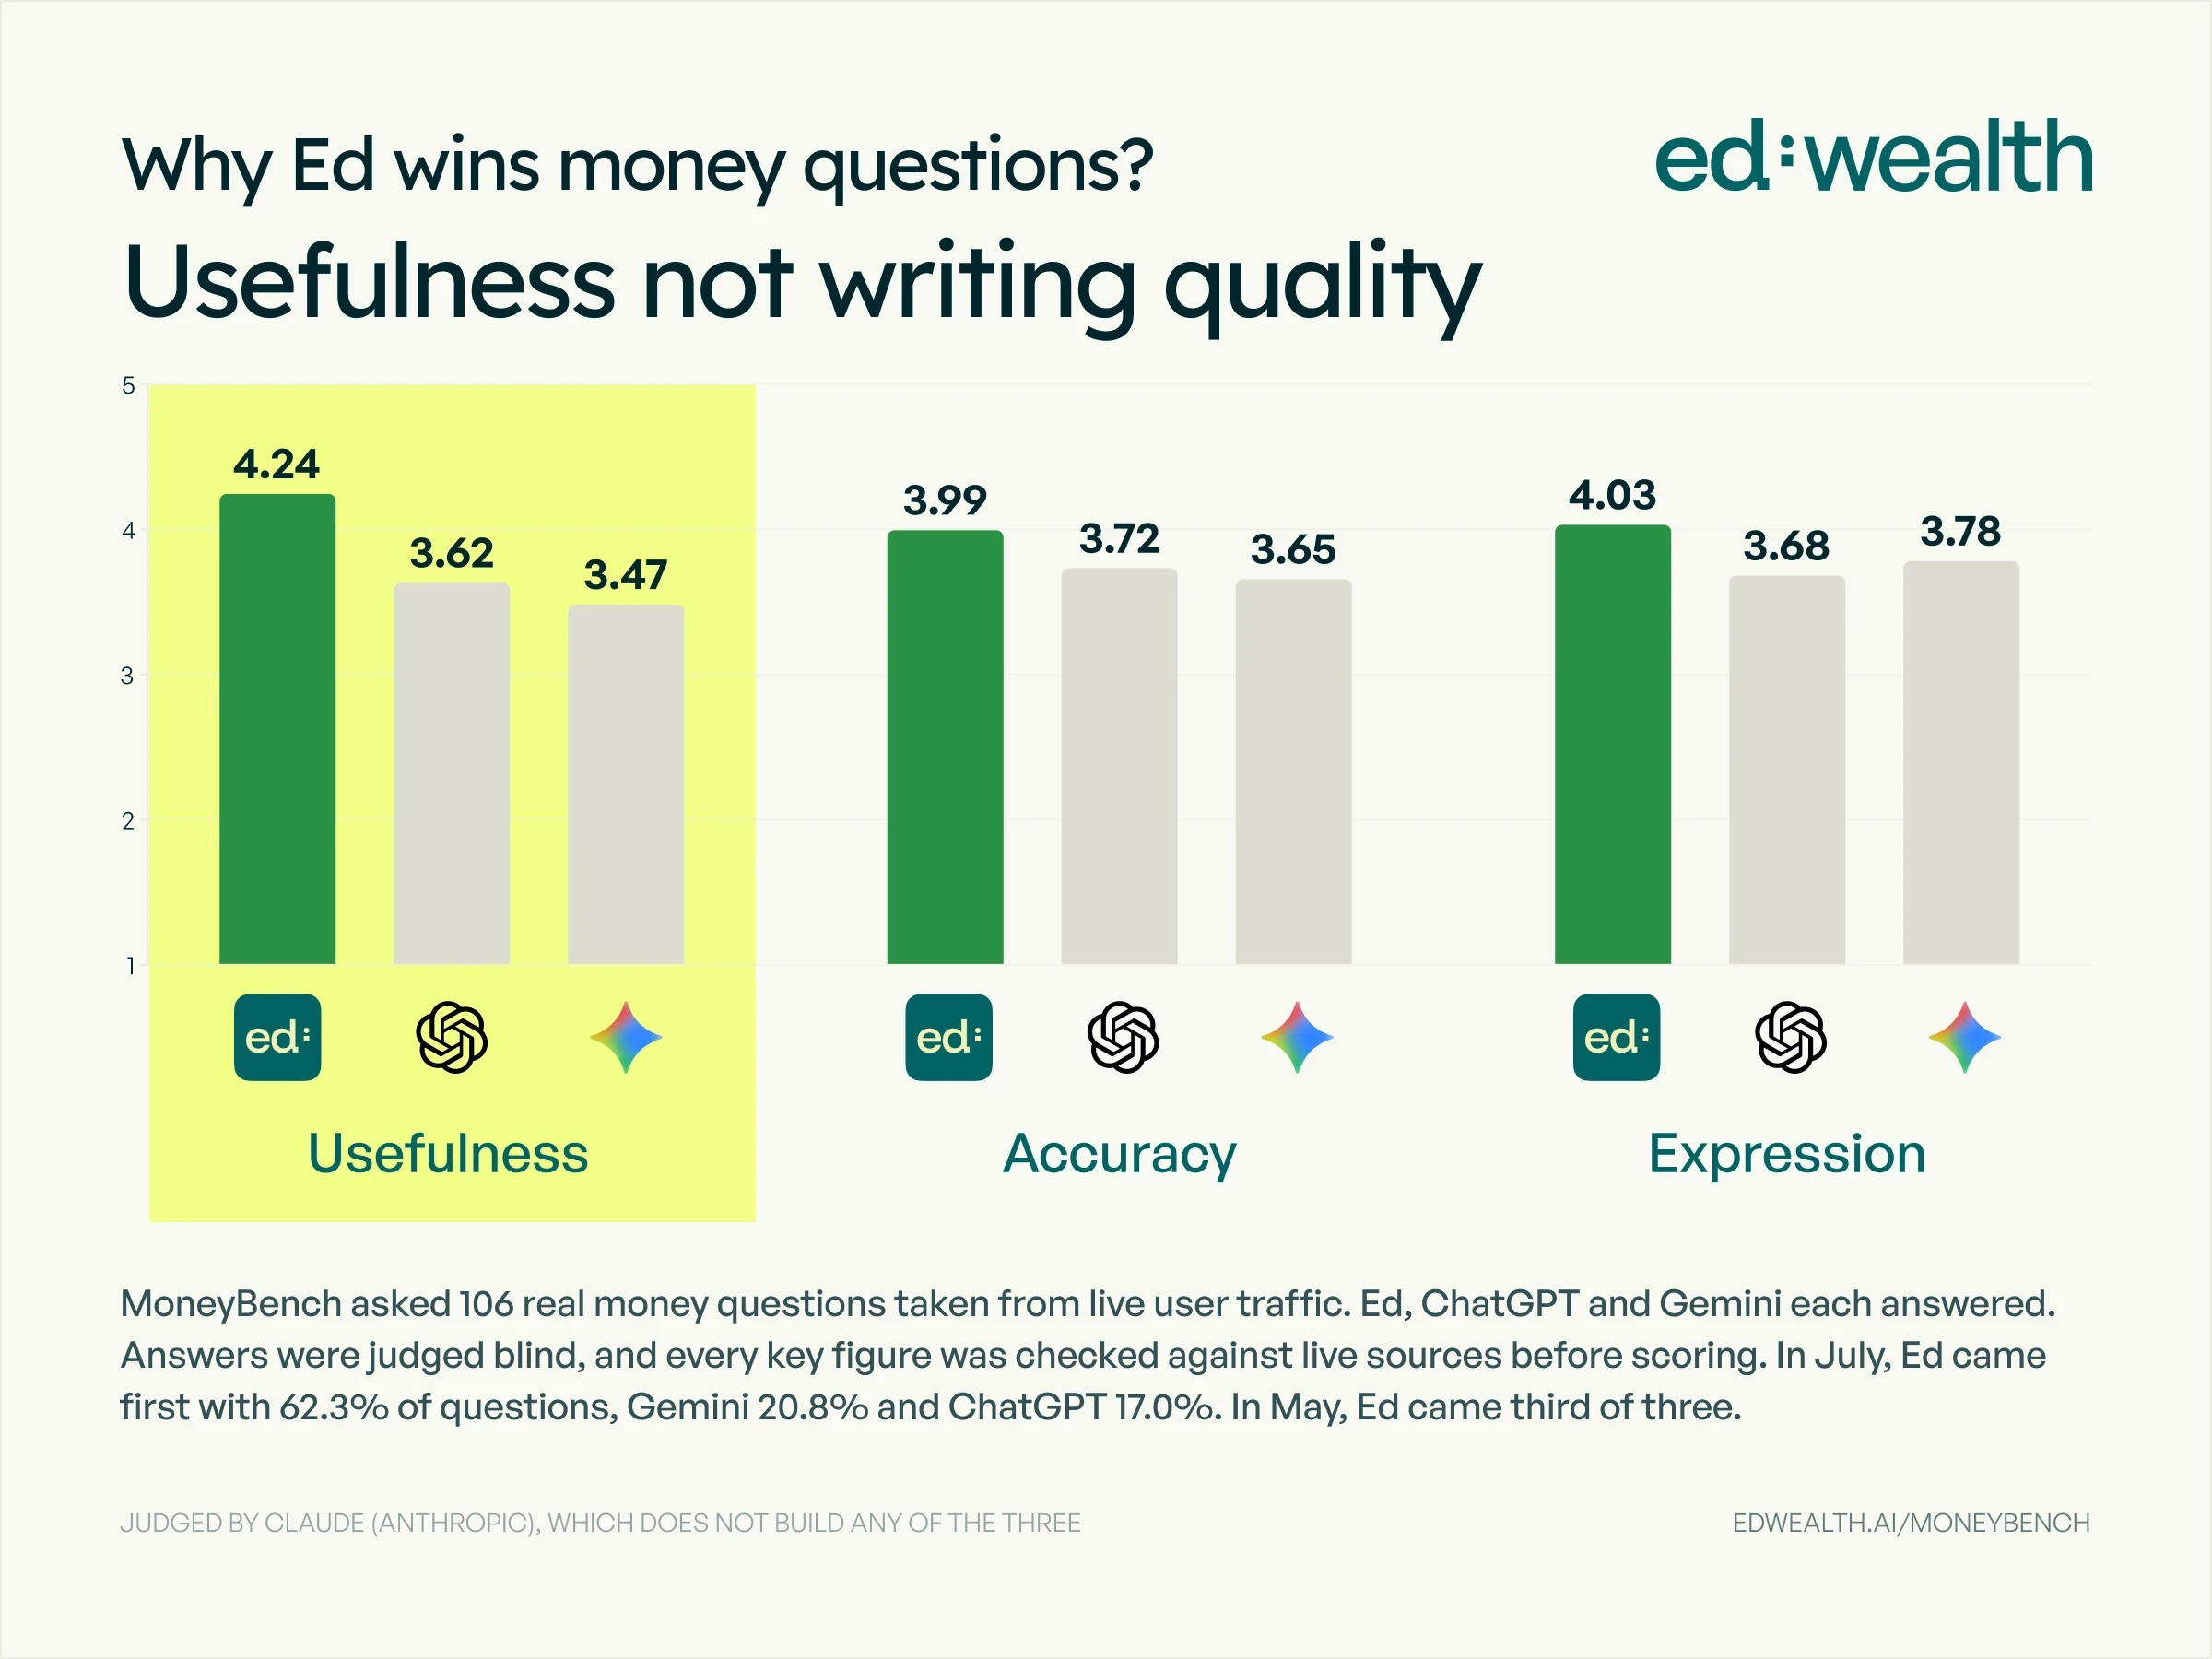
- Usefulness separated the systems. Usefulness is scored because people consult AI to decide, not only to check, and a decision needs more than a correct figure. It was the widest of three scored dimensions in July (4.24 vs 3.62 and 3.47) and the most consistent: Ed scored higher on 76/106 questions against ChatGPT and 75/106 against Gemini, lower on 15 of each.
- Two instruments point the same way, without a measured concordance. Human scorers described this property in free-text reasons and the automated judge scored it as the largest gap. The human panel scored June's 90 questions and the verified judge July's 106, so this is thematic consistency across instruments, not a concordance rate. The June cross-check did cover the panel's questions, but its per-question results were not retained (§2.4). Establishing a concordance would require the judge to re-score a slice of Panel II.
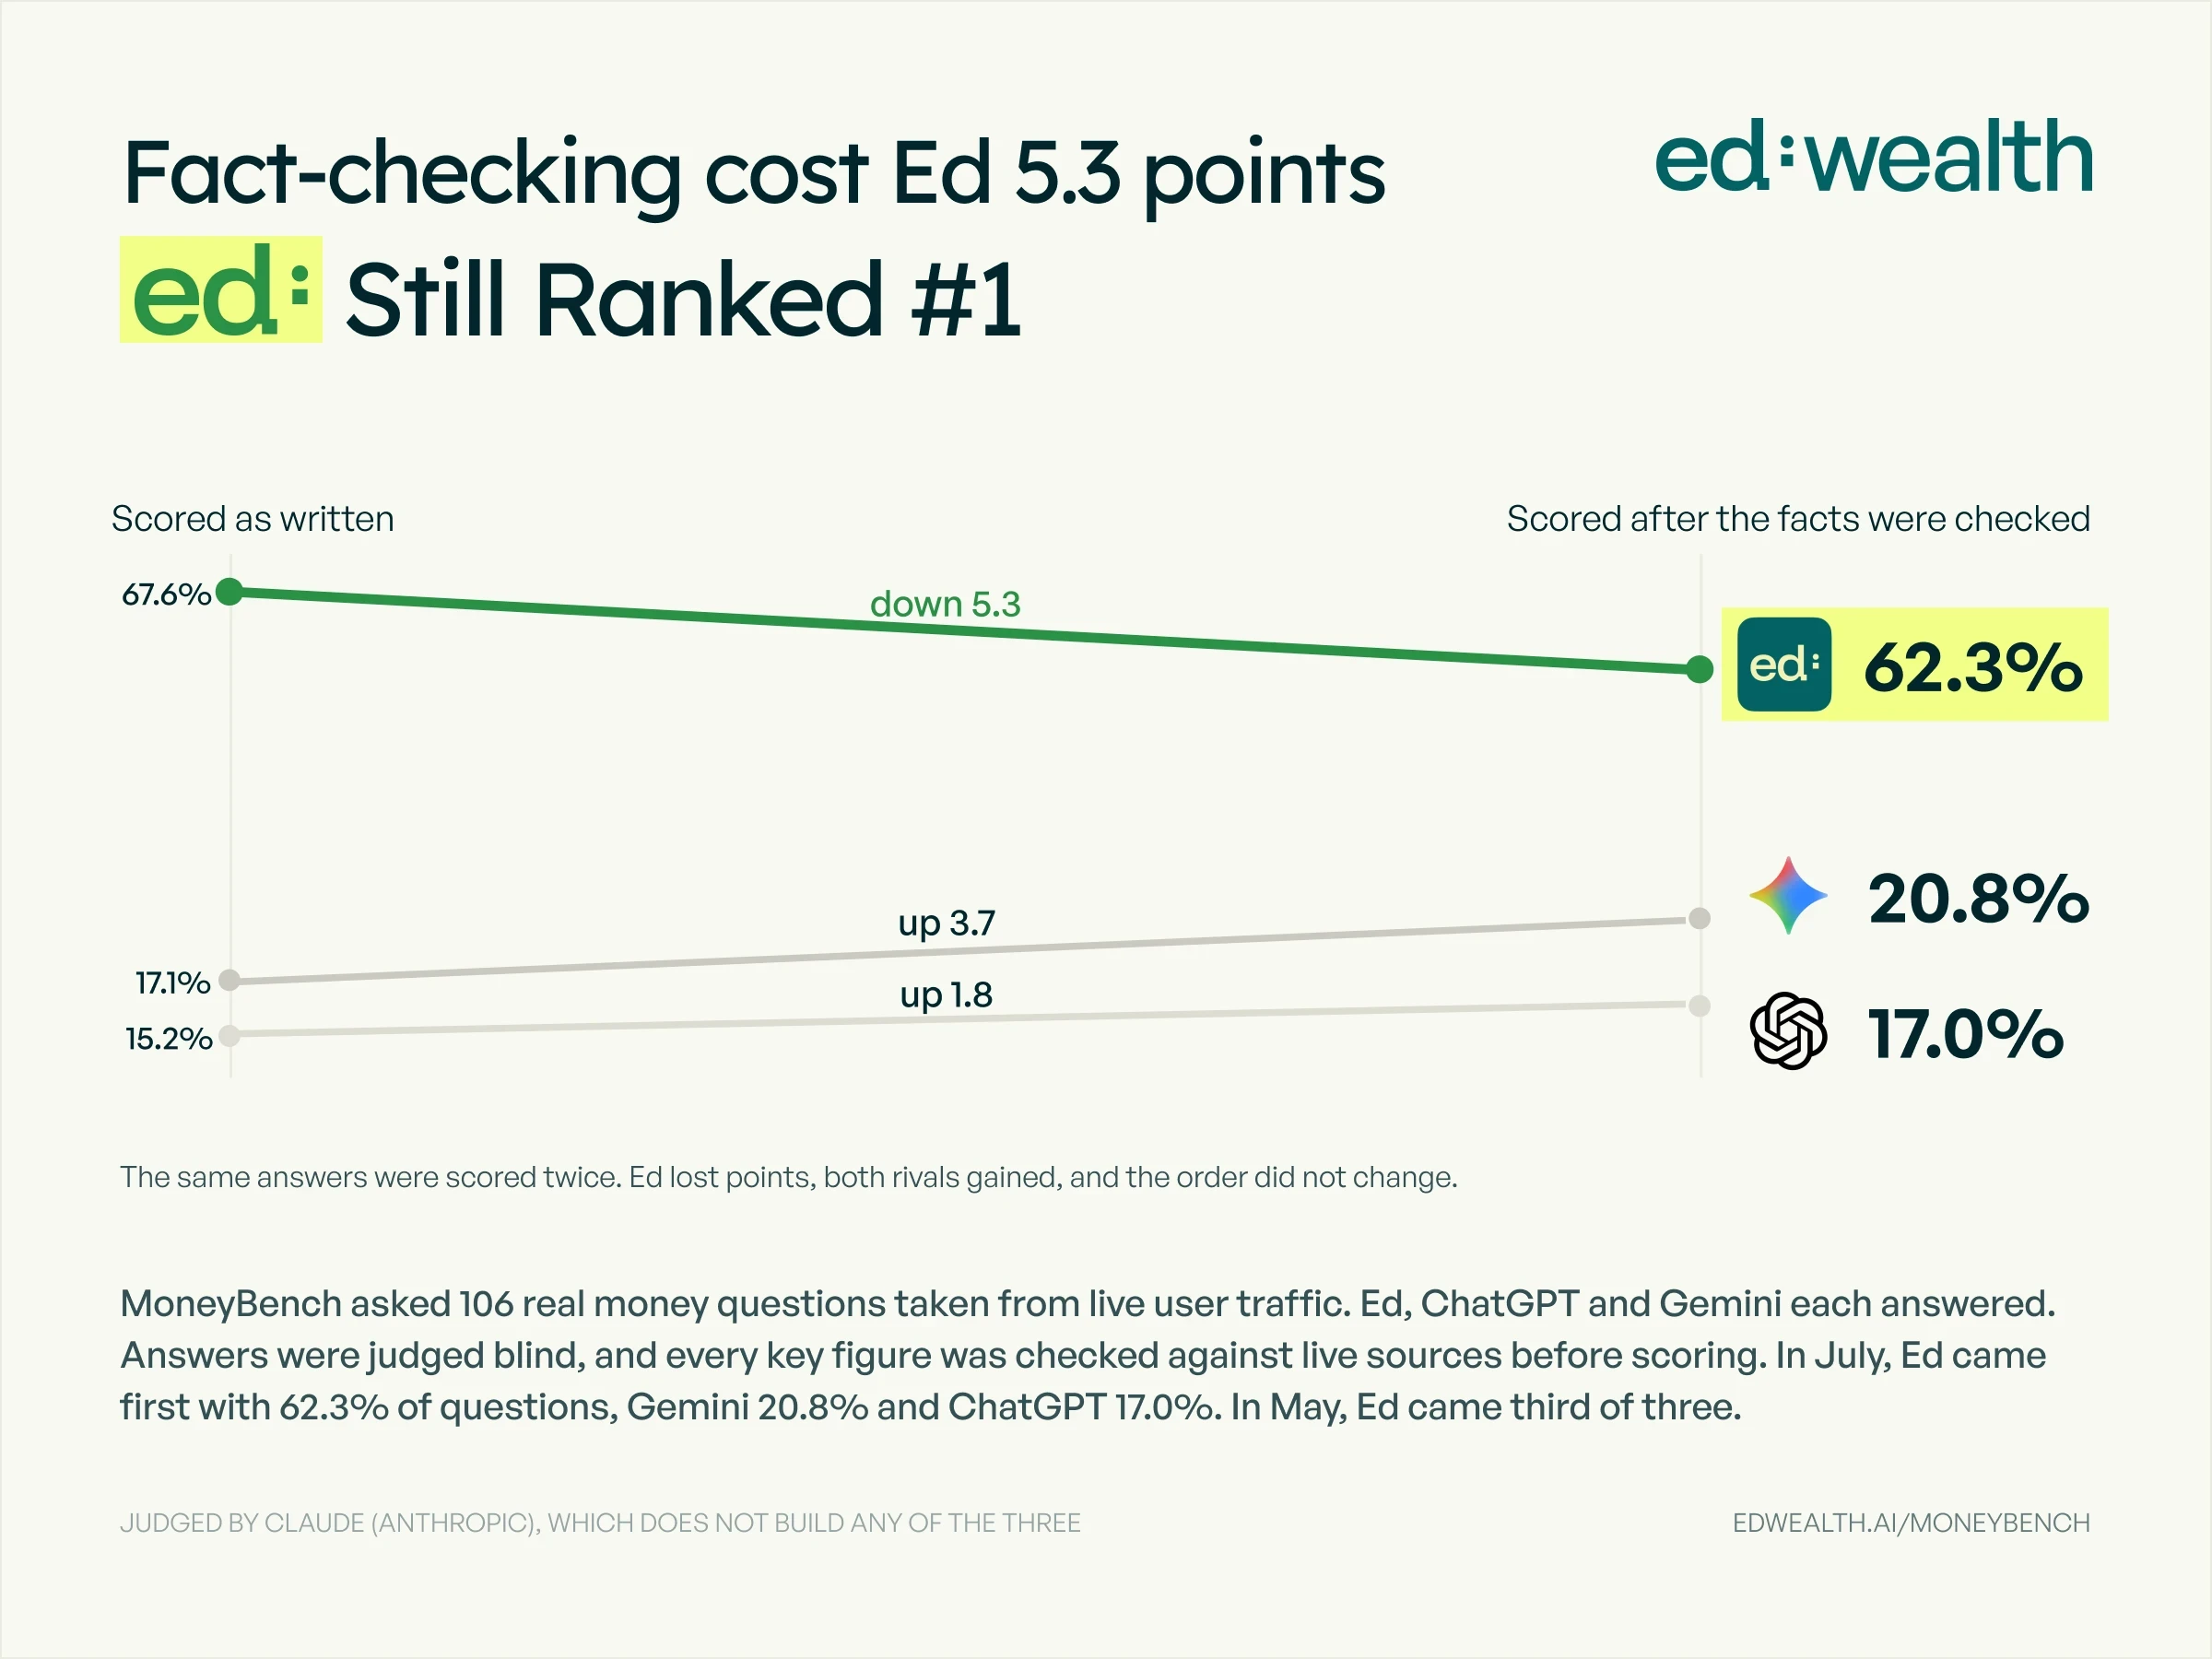
- Verification cost the sponsor and the result held. Fact verification moved Ed 67.6% → 62.3% and raised both competitors. Ed placed first after the correction.
- Expression is where the systems converge. Highest tie counts of the three dimensions (31 and 39 of 106) and the only dimension whose advantage does not reach significance against a comparator (p=0.086 vs Gemini). The convergence shows in ties and significance, not uniformly in means: against ChatGPT the expression margin (+0.35) is wider than accuracy's (+0.26).
- The May study diagnosed a delivery gap, not a capability gap. Ed placed last of three at 17.4%, but within that same study placed first on the extended-reasoning subset, 39.8% against ChatGPT 30.5% and Gemini 29.7% on the same questions, versus 15.0% on the fast path carrying 90% of traffic. The comparison is internal to one study, with all three systems answering identical questions in each mode, which is what makes it usable; routing to extended reasoning selects on question type, and the subset lead is not by itself significant (p = 0.25, §1). It is reported as the diagnosis that guided the work, not as a result.
- The advantage is uneven across audiences. Panel II scored 62% with tech-adjacent scorers and 47% with independent higher-income professionals, whose questions skewed toward planning. Aggregate figures conceal that range (§3.6).
- The aggregate is not carried by non-English questions. English-only, Ed's share rises to 68.5% (n=54); non-English is 55.8% (n=52). Vietnamese is Ed's weakest language and Gemini's strongest stratum in the Verified Evaluation, a one-question margin (§3.7).
- Question composition changed between studies, and is disclosed. Lookups were 44% of Panel I, its largest category. Panel II recorded almost no pure lookups under its source scheme, though a broader analyst-applied data-query coding covers 21 of its 90 questions. The Verified Evaluation is weighted toward live market data, though its record carries no category counts (§5). Panel I against the Verified Evaluation remains the comparison the series supports; §5 sets out the reasoning.
1. Background
Estimates of how many US adults use AI for financial guidance vary with the survey: 19% in one bank survey, 55% in another, with the highest rates among Gen Z in both (38% and 77%). 18% say they would trust an AI to make financial recommendations on its own. Reported outcomes are mixed. In the first survey, two-thirds of the adults who used AI acted on its suggestions, roughly 13% of all adults at that survey's adoption rate, and 90% of those judged the ideas profitable or worthwhile; in a separate survey of US adults, 52% of those who acted on generative-AI financial advice reported a poor financial decision or mistake based on it, roughly 44% of that survey's AI users. However adoption is counted, the advice is being acted on by tens of millions of people, and the outcomes run in both directions.
The use case those figures describe is decision support rather than reference lookup: people report consulting AI when deciding, not only when checking. Correctness is necessary for that and not sufficient, since a decision also requires knowing which figures bear on it and what they imply. MoneyBench therefore scores usefulness alongside accuracy rather than treating correctness as the whole of quality. In this report, a useful answer is one that equips the decision it addresses: it identifies the figures that bear on the question, shows how they combine, and states what they imply for the choice at hand. The instruction text that operationalised this for the automated judge is a gap in the record (§6); the human panels needed no definition, since they chose the answer they would act on and wrote down why.
Public benchmarks are well established for reasoning, code and mathematics. Consumer finance answering, where correctness is time-sensitive and errors are actionable, has no equivalent fact-verified standard. MoneyBench was built for internal decision-making and is reported here with its method specified in full, so that the method can be examined, criticised, or applied by others to their own question sets. The question set itself is not released, for the reason given in §7.
Hypothesis. A domain-specific financial system outperforms general-purpose assistants on consumer finance questions. MoneyBench was designed to be capable of falsifying this.
Prior result. Panel I (May 2026) placed Ed third of three: 17.4% against Gemini 46.1% and ChatGPT 36.5%, n=1,308 scored responses from 37 blind scorers. Loss-cause coding attributed 51.7% of losses to capability (usefulness 33.3%, accuracy 18.4%) against 19.5% to expression; the remaining 28.8% were coded no evident defect, cases where the scorer preferred another answer without identifying a flaw in Ed's. The weakest category was data lookup, at 14.4%.
The same study separated capability from delivery. On the questions routed to extended-reasoning mode (n=128), all three systems answered the same questions and Ed placed first: 39.8% against ChatGPT 30.5% and Gemini 29.7%. On the fast-response path that carried 90% of traffic (n=1,180), Ed took 15.0% against 37.1% and 47.9%. Routing to extended reasoning selects on question type, so the split is not a random assignment; it is a like-for-like comparison within each subset, which is what the diagnosis requires. At this subset size the lead is not statistically separable: 51 Ed wins against ChatGPT's 39 on the decided pairs gives p = 0.25 on a two-sided sign test. The split is reported as the diagnosis that guided the engineering work, not as a significant result; the significant results are the later studies it led to. The capability was present in the system and was not reaching most users. Work between studies targeted that gap across retrieval, task orchestration and answer construction rather than the model alone, which is why the improvement measured in later studies is not attributable to a model upgrade.
2. Method
2.1 Systems and configurations
| Role | System | Configuration |
|---|---|---|
| Subject | Ed | Production configuration. Underlying model not disclosed here; it is not an Anthropic model. |
| Comparator | ChatGPT | GPT-5.6 Sol, Pro effort (highest tier) |
| Comparator | Gemini | 3.6 Flash, default configuration |
| Judge | Claude (Anthropic) | Not a system under test; shares no model family with any of the three, Ed's undisclosed base model included |
Design principle: systems were tested in the configuration an ordinary user encounters, with each system's own browsing and grounding enabled by default. Because each system used its native retrieval, the comparison measures systems as configured for use rather than differences in tool access. Comparators ran at their defaults in Panel I and Panel II. In the Verified Evaluation, Ed and Gemini again ran their defaults, Gemini's being a lightweight tier that is not its strongest model, while ChatGPT ran at Pro effort, above its default and so advantaged relative to the principle. The July round therefore faced both newer models and a more generously configured ChatGPT than the earlier studies did, which makes it the least favourable of the three to Ed on comparator configuration.
2.2 Study 1, Panel I (May 2026)
The opening study, and the largest. Questions were weighted toward retrieval of current values: lookups made up 44% of the set. Three systems answered each question; answers were presented blind in randomised order. Each question was scored once, by one scorer, in contrast to the four to five independent scores per question in Panel II. 37 scorers produced 1,308 scored responses across 1,308 questions, making this the largest question set in the series. Single rating also means Panel I supports no majority-vote reading and no inter-rater statistic. Losses were additionally coded by cause, which produced the diagnosis the subsequent engineering work targeted.
2.3 Study 2, Panel II (June 2026)
90 questions drawn from two consumer profiles in the sponsor's user research: a tech-adjacent high earner (equity compensation, portfolio structure, sector context) and an independent professional with limited time (tax planning, allocation, funds, retirement). Each system produced one answer per question. Answers were stripped of branding and formatting tells and presented in randomised order as A, B, C. 25 blind scorers matched to the two profiles selected one best answer per question, ties disallowed, with a written reason. Each question received 4 to 5 independent scores; n=375 votes.
2.4 Cross-check (June 2026, validation)
Run before human results were read. An LLM judge scored a 263-question set containing the 90 Panel II questions, returning 57.3% for Ed with CI [50%, 64%]. No per-competitor shares were produced, so this measurement is reported as a validation check rather than a head-to-head result. Two features of the record do not reconcile exactly with n=263: 57.3% is not an integer fraction of 263, and the interval is wider than a share counted over 263 questions implies. Both are consistent with the share having been computed over a smaller denominator of decided questions, ties excluded, but the per-question tallies were not retained, so the figures are reported as recorded. Because the cross-check set contains the Panel II questions, its agreement with the human panel is a consistency check between two judges over shared material, not an independent replication.
2.5 Study 3, Verified Evaluation (July 2026)
106 questions drawn from several days of live production queries rather than authored for the test. The set therefore contains what users actually send: underspecified requests, misspelled tickers, mixed-language phrasing, and requests for chart output the assistant cannot render. 100 questions ran in fast-response mode, 6 in extended reasoning. Answers were presented to the judge under anonymous labels in positions randomised per question. Whether answer content was additionally stripped of identifying features, as it was for the human panels, is not documented in the record (§6).
Language distribution was uneven, reflecting the traffic it was drawn from: English 54, Vietnamese 36, Chinese 14, Turkish 2. Results by language are reported in §3.7.
Questions were screened for personal information before use and are reported in paraphrase rather than verbatim throughout this report.
The judge verified key facts in each answer against live sources before scoring: prices, valuations, dividends, holdings, filing dates. Facts were checked against sources as of 23 July 2026; answers were generated in the same window, so verification measured correctness at the time of answering rather than subsequent market movement. Verification succeeded on 106/106 questions, 0 unverifiable.
| Parameter | Specification |
|---|---|
| Dimensions and weights | Accuracy 0.45, usefulness 0.35, expression 0.20; 1–5 scale. Weights were set before scoring. Numeric anchors for individual scale points were not specified, so dimension scores carry the judge's own calibration; sensitivity to the weighting is tested in §3.5. This applies to the Verified Evaluation alone, which is the only study scoring dimensions on a scale. Panel I and Panel II asked scorers to select the best of three answers under forced choice, so no rating scale required anchoring. The verbatim instruction text given to the judge, including its operational definition of each dimension, is not part of the analysis record this report draws on and is not reproduced here. |
| Decision rule | Forced single winner per question, highest weighted score |
| Accuracy veto | Answers containing a fact falsified by verification cannot win |
| Close-call tagging | Top two within 0.3 weighted points flagged, confidence downgraded |
| Confidence distribution | High 35, medium 43, low 28 |
3. Results
3.1 Headline shares
| Round | Judge | n | Ed | Gemini | ChatGPT |
|---|---|---|---|---|---|
| Panel I, May | 37 blind scorers | 1,308 votes | 17.4% | 46.1% | 36.5% |
| Panel II, Jun | 25 blind scorers | 375 votes, 90 Q | 54.4% | 28.3% | 17.3% |
| Verified Eval, Jul | Claude, fact-checked | 106 Q | 62.3% | 20.8% | 17.0% |
Panel II per-question outcomes: Ed won 50 of the 90 questions outright (55.6%). Of the 71 questions that produced a clear winner, Ed took 70.4%, Gemini 19.7% and ChatGPT 9.9%; 19 tied. Both denominators are given because the second excludes ties and the first does not. A cluster bootstrap on the 54.4% vote share, recomputed for this report from the vote records, gives a 95% interval of approximately [48%, 61%] whether whole questions or whole scorers are resampled; a naive vote-level interval reads [49%, 59%]. The extra width comes mainly from heterogeneity across scorers, who individually chose Ed between 20% and 93% of the time (§3.5), and to a lesser degree across questions, so the interval describes how far a different panel or question draw could land rather than uncertainty in the recorded count. Its width is consistent with the low per-question agreement reported in §3.5. The Cross-check (§2.4) returned 57.3% for Ed with CI [50%, 64%], within which the human panel's 54.4% subsequently fell. One ordering is reported without interpretation: ChatGPT placed third in Panel II at its default configuration and third again in the Verified Evaluation at Pro effort, behind Gemini's free default tier both times, under a human panel in one case and an automated judge in the other. The protocol cannot separate model behaviour from judge calibration in that ordering.
3.2 Dimension scores
3.3 Per-question consistency
Means can be produced by a minority of large margins. Table 4 counts outcomes question by question against each comparator separately.
| Dimension | vs ChatGPT | Mean Δ | vs Gemini | Mean Δ |
|---|---|---|---|---|
| Usefulness | 76 / 15 / 15 | +0.62 | 75 / 16 / 15 | +0.77 |
| Accuracy | 58 / 21 / 27 | +0.26 | 55 / 19 / 32 | +0.34 |
| Expression | 51 / 31 / 24 | +0.35 | 41 / 39 / 26 | +0.25 |
| Weighted total | 78 / 1 / 27 | n/a | 73 / 2 / 31 | n/a |
Usefulness is the most consistent dimension and carries the largest margin. Ed loses it on 15/106 against either comparator, approximately half its accuracy loss rate. Expression produces the highest tie counts, 31 and 39.
A stricter comparison qualifies the accuracy result. Measured against whichever comparator scored higher on each individual question, a test biased against any single system because the maximum of two draws exceeds one draw even among identical systems, Ed's accuracy and expression margins fall to approximately parity (mean Δ −0.13 and −0.07) while usefulness remains positive (+0.23). Ed's accuracy lead holds against each system taken separately and should be read that way. The comparison is a stress test rather than a description of available practice: selecting the better of two answers requires knowing which is better, which is the information the question was asked to obtain.
3.4 Effect of fact verification
The Verified Evaluation was scored twice on the same answers: once on unverified assessment, once after each answer's key facts were checked against live sources.
| System | Unverified | Verified | Δ |
|---|---|---|---|
| Ed | 67.6% | 62.3% | −5.3pp |
| Gemini | 17.1% | 20.8% | +3.7pp |
| ChatGPT | 15.2% | 17.0% | +1.8pp |
Verification corrected against the sponsor's system and toward both comparators. The aggregate ranking was the same on both passes; what changed was the margin, by 5.3 points against the sponsor, and individual-question outcomes in both directions, including one disqualification under the accuracy veto. The operational case for verified benchmarking is that without the verification pass this correction is invisible: an unverified score cannot distinguish a real margin from one inflated by errors that read plausibly.
3.5 Statistical robustness
Three checks: whether the per-question margins survive significance testing, whether the result depends on the chosen weights, and how far the human panel agreed with itself.
| Dimension | vs ChatGPT | p | vs Gemini | p |
|---|---|---|---|---|
| Usefulness | 76W–15L | <0.001 | 75W–15L | <0.001 |
| Accuracy | 58W–27L | 0.001 | 55W–32L | 0.018 |
| Expression | 51W–24L | 0.002 | 41W–26L | 0.086 |
Six tests are reported; under a Holm correction every result except expression against Gemini retains significance at the 0.05 level. The usefulness advantage is significant at p<0.001 against both systems. The expression advantage over Gemini is not significant at conventional thresholds, which is consistent with the reading that expression is where the systems converge. Ed's overall share of 62.3% carries a bootstrap 95% confidence interval of [52.8%, 71.7%] (10,000 resamples), against a three-way chance baseline of 33.3% (z = 6.32).
| Weighting, accuracy / usefulness / expression | Ed wins |
|---|---|
| 0.45 / 0.35 / 0.20, as scored | 58.5% |
| Equal thirds | 56.6% |
| 0.60 / 0.30 / 0.10, accuracy-weighted | 55.7% |
| 0.70 / 0 / 0.30, usefulness removed | 46.2% |
| 1.00 / 0 / 0, accuracy only | 36.8% |
| 0 / 0 / 1.00, expression only | 23.6% |
Recomputed on outright wins only, which is why the first row reads below the 62.3% in §3.1. The difference is not a denominator effect. 62.3% is 66 of 106 and includes questions Ed did not win on weighted score alone; 58.5% is 62 of 106 and counts only those it did. The four-question gap resolves into two distinct mechanisms: on three questions Ed was tied at the top and the forced single-winner rule of §2.5 resolved the tie, and on one question a comparator scored higher on weighted total but carried a fact falsified by verification and was disqualified under the accuracy veto. The three tie counts are consistent with Table 4, which records Ed tied on weighted total once against ChatGPT and twice against Gemini.
Two things about that should be stated rather than left to inference. All three tie-breaks resolved in the sponsor's favour, and the procedure used to break a tie is not specified in the source protocol. Three questions on a set of 106 cannot account for the reported margin, but the reader is entitled to know that the decision rule is undocumented at exactly the point where it was used. The outcome does not depend on the chosen weights: Ed leads under equal weighting and under accuracy-weighted scoring. It does depend on usefulness. Removing that dimension drops Ed to 46.2%, and scoring accuracy alone drops Ed to 36.8%, near the three-way chance baseline. Accuracy scores tie frequently, so a mean advantage on accuracy does not convert into outright per-question wins. The advantage this report identifies is a usefulness advantage, and the weighting test says so more precisely than the headline share does.
| Stratum | n | Ed | Gemini | ChatGPT |
|---|---|---|---|---|
| High confidence | 35 | 68.6% | 17.1% | 14.3% |
| Medium confidence | 43 | 67.4% | 18.6% | 14.0% |
| Low confidence | 28 | 46.4% | 28.6% | 25.0% |
| Clear margin (not close) | 56 | 75.0% | n/a | n/a |
| Close call | 50 | 48.0% | n/a | n/a |
The result is stronger where the evidence is stronger. Ed takes 68.6% of high-confidence questions against 46.4% of low-confidence ones, and 75.0% of clear-margin questions against 48.0% of close calls. A result produced by scoring noise or by the tie-breaking rule would show the opposite concentration, with the lead sitting in the ambiguous stratum. It does not. The corollary is that on genuinely close questions the three systems are near-indistinguishable, which is the honest reading of the 47% close-call rate.
Agreement within the June human panel was low. Fleiss' κ = 0.026 across the 75 questions scored by exactly four raters, meaning scorers agreed on individual questions at close to the rate their overall vote distribution alone would predict. Across all 90 questions, 12% were unanimous, 52% produced an outright majority and 79% a plurality winner. On this set's mix of four and five raters, independent voting at the observed vote shares would produce approximately 9% unanimity and 52% outright majorities, so the majority rate sits at chance and unanimity barely above it, which is κ = 0.026 restated. The aggregate preference is therefore robust and the per-question agreement is not: Ed took 204 of 375 votes across a divided panel. Individual scorers selected Ed between 20% and 93% of the time, mean 54%; removing the single highest scorer leaves the lead intact. This is consistent with the independent finding that the automated judge flagged 47% of its questions as close calls. Two instruments, applied a month apart, both indicate that the systems are frequently near-tied on individual questions and that the separation appears in aggregate.
3.6 Variation by audience
Panel II drew its scorers from two audience profiles and matched question sets to each. The result was not uniform across them.
| Group | Scorers | Questions | Ed | Gemini | ChatGPT |
|---|---|---|---|---|---|
| A, tech-adjacent higher earners | 12 | 45 | 62% | 24% | 14% |
| B, independent higher-income professionals | 13 | 45 | 47% | 32% | 21% |
Per question, Gemini took 11 from group B against 3 from group A. The free-text reasons from group B scorers who selected against Ed are consistent in what they asked for: graduated options rather than one recommendation, self-check steps, and an absence of instruction. Ed's strongest properties on data questions, density and a single clear conclusion, work against it here.
Group B's questions skewed toward planning and long-horizon decisions while group A's skewed toward markets and equity compensation, so audience and subject matter vary together and neither can be isolated. What the split does establish is that the aggregate figure conceals a range, and that the weaker end of that range sits on planning questions. The split also does not separate two readings of that weakness: an audience whose needs these answers do not yet meet, or a preference structure in which any single-recommendation answer loses regardless of quality. Nothing in this data distinguishes them, and they imply different responses.
3.7 Variation by language
The Verified Evaluation carried four languages in the proportions of the traffic it was drawn from (§2.5). Strata of comparable size are reported in §3.5, so the language split is reported on the same basis rather than withheld. The Chinese figure is directional at n=14; the two Turkish questions support nothing and are shown for completeness.
| Language | n | Ed | Gemini | ChatGPT |
|---|---|---|---|---|
| English | 54 | 68.5% | 11.1% | 20.4% |
| Vietnamese | 36 | 44.4% | 41.7% | 13.9% |
| Chinese | 14 | 85.7% | 7.1% | 7.1% |
| Turkish | 2 | n/a | n/a | n/a |
Two results follow. First, the aggregate is not carried by non-English questions. Ed's English-only share, 68.5% (n=54), is higher than the 62.3% aggregate; its non-English share is 55.8% (n=52). Restricting the set to English strengthens the headline result rather than weakening it.
Second, Vietnamese is Ed's weakest language and Gemini's strongest stratum in the Verified Evaluation: 41.7% against its 20.8% July aggregate, a one-question margin (Ed won 16 of the 36, Gemini 15). Gemini's Panel I share was higher still, 46.1%, under different questions and judges. Ed's own dimension scores barely move between English and non-English questions (usefulness 4.22 against 4.26, accuracy 4.01 against 3.96), so the near-tie reflects Gemini improving in Vietnamese rather than Ed degrading outside English.
4. Analysis
4.1 The margin is concentrated in usefulness
Expression is the most tied dimension, the only one whose advantage does not reach significance against a comparator (§3.5), and the one dimension on which Gemini exceeds ChatGPT. Its mean margins are not uniformly the smallest: against Gemini expression is the narrowest margin (+0.25 against accuracy's +0.34), but against ChatGPT it is not (+0.35 against +0.26). What the pattern excludes is prose quality as the driver of the result: a prose-driven advantage would produce its widest and most consistent margin on expression, and instead that margin sits on usefulness, at 1.8 to 3.0 times the other dimensions and significant at p<0.001 against both systems where expression fails significance against one. Presentation is not thereby excluded: two of the five coded scorer themes in §4.3, legible structure and conclusion-first ordering, describe how an answer is organised. The distinction this report draws is between organisation that makes an answer checkable and prose that makes it pleasant, and the evidence supports the former. Usefulness, as defined in §1, holds across roughly 71% of individual questions.
Two engineering properties are consistent with this distribution. First, a retrieval layer specific to financial data: the judge's verification notes describe Ed's answers as carrying current filings, intraday ranges and holdings tables, the layer rebuilt after Panel I identified it as the weakness. Second, answer construction matched to decision-making: conclusion stated first, derivation shown, options compared, tabular presentation.
The distribution is not supported by three alternative explanations, though none is formally excluded. Model capability sits poorly with the parity of expression scores and with the Panel I to Panel II change occurring without a model upgrade, but a stronger model could in principle match on prose and lead on substance. Personal context is excluded by design: all systems answered standalone questions with no user data. Presentation quality is addressed in §4.2.
4.2 Is the usefulness advantage a presentation effect?
The most common objection to this result is that usefulness measures formatting rather than substance: tables, headings and conclusion-first ordering rather than better financial content. The objection is testable, because formatting does not vary with whether an answer is factually right. If usefulness tracked presentation, a system's usefulness score would hold up on questions where its facts were poor.
It does not. On the 14 questions where Ed's verified accuracy scored 3.0 or below, Ed's usefulness fell to 1 win, 3 ties and 10 losses against the better comparator per question, against 64 wins, 22 ties and 20 losses on the same best-of-two basis across all 106 questions. The premise this test rests on is that Ed's answer format comes from one production pipeline and does not vary with whether its facts happen to be right; the answer texts are not in the record (§6), so the premise is stated as a property of the system rather than verified per answer. On that premise, a purely presentational usefulness score should have survived this subset, and it collapsed.
The correlation structure is a second test, computed within each system rather than pooled, since pooling inflates association through differences in overall quality between systems.
| System | usefulness ~ accuracy | usefulness ~ expression | accuracy ~ expression |
|---|---|---|---|
| Ed | 0.747 | 0.350 | 0.341 |
| ChatGPT | 0.806 | 0.640 | 0.597 |
| Gemini | 0.860 | 0.827 | 0.814 |
For Ed the dimensions separate: usefulness tracks accuracy at 0.747 and expression at 0.350, and a presentation property would track expression more closely. For ChatGPT the pattern is similar but weaker (0.806 against 0.640). For Gemini all three dimensions move together at 0.81 to 0.86. One judge produced every score in the table under one protocol, so a single reading must cover all three rows. If the judge were applying an undifferentiated overall impression, all three systems would show Gemini's structure; Ed's differs under the same judge, which indicates the scores separate where the answers give grounds to separate them. Symmetrically, Gemini's uniform correlations may mean its answer quality genuinely moves as one property, or that its answers offered no basis for distinguishing the dimensions. The table cannot tell those apart, and the single-judge limit in §6 applies to every row equally.
Score dispersion qualifies the Ed row. Per-dimension standard deviations, computed for this report from the per-question scores, are 0.67, 0.59 and 0.39 for Ed's accuracy, usefulness and expression, against 0.71 to 0.98 for the comparators: Ed's expression scores have roughly half the spread of the other systems'. A restricted range attenuates correlations mechanically, so part of Ed's low usefulness-to-expression figure is arithmetic rather than structure. The weak-facts subset test above does not depend on the correlations, and it carries the weight of this section.
What this section establishes is that the presentation-only explanation is not supported. It does not establish that presentation plays no part, and the limits on the evidence are set out in §6.
Presentation is not irrelevant, and §4.3 shows two of five scorer themes describing how an answer is organised. The evidence indicates that organisation contributes to usefulness only when it is organising correct material.
4.3 Scorer free-text reasons
The 129 free-text reasons written by Panel II scorers who selected Ed by clear margin (38 questions) were coded into themes.
| Theme | Chose Ed (n=129) | Chose against Ed (n=79) |
|---|---|---|
| Explains its logic, not only its conclusion | 26% | 32% |
| Legible structure; tables and headings | 26% | 29% |
| Conclusion precedes supporting detail | 21% | 30% |
| Data sufficient, not merely present | 17% | 22% |
| Options compared rather than a single pick | 15% | 15% |
Both columns were coded with the same scheme, on samples defined by strength of consensus rather than by the plurality rule used in §3.1. The first draws on 129 reasons from the 38 questions where at least three scorers chose Ed; the second on 79 reasons from the 23 questions where at most one scorer chose Ed and at least three scored it. The two thresholds are not symmetric, and neither is the same as the 71 clear-plurality questions of §3.1, which is why the counts do not reconcile against that figure. Reporting only the first would establish that scorers who chose Ed described Ed, which is not a finding. Reasons could carry more than one code, so the columns sum to more than 100%: coding density is 1.05 codes per reason in the first column and 1.28 in the second, and raw percentages overstate the second column's themes by roughly that ratio. A further limit: at these consensus thresholds the panel exceeds chance-level agreement by only a few points (§3.5), so the strata are samples of written reasons rather than a reliably decided set of questions. Nothing in this section treats them as decided; the finding is the similarity of criteria across the two columns, which does not depend on the strata being signal.
The two columns are close, and that similarity is the result. Scorers apply a consistent set of criteria irrespective of which answer they pick, so the themes are properties of what this audience wants rather than descriptions of one system, and Ed's losses are failures against the same criteria its wins satisfy. Normalised for coding density the columns come closer still: the apparent 9-point divergence on conclusion-first ordering falls below 4 points, and legible structure tips slightly toward Ed. No per-theme divergence survives that correction, so none is claimed. None of the ten figures describes prose quality.
4.4 Longitudinal consistency of the axis
| Dimension | Panel I, May | Verified Evaluation, Jul |
|---|---|---|
| Usefulness | Largest loss cause, 33.3% of losses | Widest lead, +0.62 / +0.77 |
| Accuracy | 18.4% of losses, coded capability | Leads both comparators, +0.26 / +0.34 |
| Expression | 19.5% of losses, coded preference | Most tied; not significant vs Gemini |
The dimension on which the system failed most in May, usefulness, is the dimension on which it leads most in July. Expression and accuracy carried near-equal shares of the May losses, 19.5% and 18.4%; in July, accuracy is a lead against each comparator while expression is the most tied dimension and the only one not significant against a comparator. One targeted engineering intervention sits between the measurements, and the change concentrates where it aimed. What a targeted intervention predicts, and a general capability gain does not, is this asymmetry: the targeted dimension moves from largest weakness to widest lead while the others move less.
5. Series composition
MoneyBench's three studies are related tests rather than repeated runs of one instrument, and the question mix moved between them.
| Study | Composition | Ed result |
|---|---|---|
| Panel I | Lookups of current values 44% of test (575/1,308 responses) | 3rd, 17.4%; lookup category 14.4% |
| Panel II | Dividend safety, allocation, valuation, long-horizon decisions; almost no pure lookup under the source scheme, 21/90 under a broader data-query coding | 1st, 54.4% |
| Verified Eval | Live prices, holdings, analyst tables; verification applied | 1st, 62.3% |
Panel II's composition followed a change in product focus toward planning and portfolio questions. Panel II is therefore evidence of performance in that category, not evidence that the retrieval weakness identified in Panel I was resolved. The Verified Evaluation returned to Panel I territory, added fact verification, and ran against upgraded comparators. Panel I against the Verified Evaluation is the comparison MoneyBench currently supports. The mechanism described in §1 does not depend on the later composition changes: it was measured within Panel I, on subsets where all three systems answered the same questions, before any question set changed. Routing to extended reasoning selects on question type, so the mode split compares like with like inside each subset rather than across a random assignment.
Each study applied its own category scheme, so category-level figures are not comparable across studies. One category result stands on its own terms: of 21 Panel II data-query questions, Ed won all 15 that produced a clear winner and neither comparator won any. It is not set against Panel I's 14.4% lookup figure: the 21 questions were coded under a broader, analyst-applied data-query definition, 16 of the 21 categorised by the analyst rather than pre-labelled in the source, and the two shares are computed on different bases. The Verified Evaluation record carries no per-question category labels, so its composition is described from the verification log rather than counted; coding it now would introduce a third scheme with the same comparability problem.
5.1 Verification log, selected questions
| Question | Winner | Verified finding |
|---|---|---|
| Gold price trend | Ed | Spot 4,048–4,053 on 23 Jul; Ed's range closest |
| Berkshire Alphabet position | Ed | Stake more than tripled in Q1 2026, 17.8M to c.57.8M shares; Ed matched filing |
| NVDA analyst targets | ChatGPT | Consensus 302.83 across 61 analysts; ChatGPT's table closest |
| Bitcoin price and technicals | Gemini | BTC c.65,659 on 23 Jul; Gemini's read cleanest |
| Istanbul exchange listings | ChatGPT | Four approved listings with prices; Ed scored 1.5 on accuracy |
Verification was applied identically to all three systems and determined outcomes in both directions. No system verified cleanly on every question: mean accuracy was 3.99 for Ed, 3.72 for ChatGPT and 3.65 for Gemini, on a 5-point scale. Counting answers whose verified accuracy fell below the scale midpoint of 3, of 106 each: Ed 9, ChatGPT 7, Gemini 16; at 2 or below, 2, 4 and 10. On the first count ChatGPT produced fewer materially flawed answers than Ed, which the means conceal.
6. Limitations
- The two verification passes do not cover an identical set. The verified pass resolves to 106 questions; the unverified shares resolve to 105, so one question appears absent from the first pass. The discrepancy is small relative to the reported difference of 5.3 points, and unexplained.
- The presentation test in §4.2 has three limits. Because usefulness and accuracy correlate at 0.747 for Ed, selecting questions on low accuracy depresses that subset's usefulness scores partly as arithmetic, so the collapse is not wholly independent evidence. One judge produced all three dimension scores, so nothing separates a real dimensional distinction from a single rater's internal consistency. And Ed's expression scores carry roughly half the dispersion of the comparators' (SD 0.39 against 0.71 and 0.80), which attenuates its usefulness-to-expression correlation through range restriction alone.
- Automated judging is not user judgment. The Verified Evaluation is automated throughout. Its weight derives from fact verification and from thematic consistency with the human panels' stated criteria; a measured concordance with human judgment does not exist (Finding 2).
- 47% of Verified Evaluation questions were close calls (top two within 0.3 weighted points). Aggregate margins are larger than typical per-question margins.
- Composition favours a finance-specific system. The Verified Evaluation set is weighted toward live market data, where verification is most discriminating and a domain retrieval layer has the most structural advantage. Planning and behavioural questions are better represented in Panel II.
- Configurations follow the default-use principle, not parity of tier or price. ChatGPT ran above its default at Pro effort; Ed and Gemini ran at theirs. A round with all systems maximally provisioned would answer a different question and is the indicated next study. Price is not controlled in either direction: Ed is a paid subscription, Gemini ran free, and the ChatGPT tier used is considerably more expensive than Ed.
- Human panel agreement was low. Fleiss' κ = 0.026 (§3.5). The aggregate preference is significant; agreement on individual questions is not. Claims here rest on aggregates, not on the panel having converged question by question.
- Audience coverage is narrow and confounded. Panel II used two scorer groups of 12 and 13, each scoring a different question set, so audience characteristics and subject matter cannot be separated (§3.6). The groups were also single-gender as constituted, which is a property of recruitment rather than a variable under test.
- Language coverage is uneven. English 54, Vietnamese 36, Chinese 14, Turkish 2. §3.7 reports the split; the Chinese figure is directional at n=14 and the Turkish questions support nothing.
- Accuracy parity against best-of-field. Reported in §3.3. Ed's accuracy lead holds against each system individually but not against the better of the two selected per question.
- The sponsor is a participant. Countermeasures are listed in the disclosure above and specified in §2.
- The judge's instruction text is not in the record. The dimension weights and decision rules are documented (§2.5); the verbatim prompt defining each dimension for the judge, including usefulness, the dimension that carries the result, is not. Until it is recovered and published, which any future MoneyBench round should treat as a release requirement, the protocol is not fully executable by a third party.
- Blinding of the Verified Evaluation is positional, not established at the content level. Answers were scored under anonymous labels in per-question randomised positions, but the record does not document content de-identification, and a language-model judge can in principle recognise a system by its style. The human panels stripped branding and formatting tells; the equivalent step is not documented for the automated study.
- Answer length and structure are not controlled. The analysis record retains scores, verification notes and judge rationales but not the answer texts, so token counts, structure counts and length-controlled win rates cannot be computed from it. Preference for longer answers is a documented failure mode of LLM judges, and the answer pattern associated with Ed, conclusion first, derivation shown, tables, correlates with length and structure. A length-controlled recomputation, once the answer texts are recovered from the test operator, is the indicated robustness check.
7. Conclusions
7.1 Usefulness and accuracy are separable properties, and evaluation that omits fact verification measures neither reliably. Identical answers scored differently before and after verification: the sponsor's margin fell 5.3 points and both comparators rose, with the ranking unchanged. The asymmetry between the two properties matters at the point of use. Panel II's 208 coded reasons describe structure, logic, ordering and completeness; none describes factual correctness, which a reader has no practical way to check. Unverified scoring, which is the condition under which answers are actually read, rated the sponsor's system higher than verified scoring did; the advantage survived that correction.
7.2 The measured advantage is concentrated in usefulness and is consistent across questions. The automated judge scored it as the widest margin, and the criteria human scorers wrote down describe the same property, a thematic alignment rather than a measured concordance (Finding 2). Expression, the property most readily mistaken for quality, is where the systems converge. The hypothesis in §1 was not that Ed reasons better than a frontier model. It was that a system built for one domain outperforms general assistants inside it. The evidence supports that hypothesis, and does not extend beyond it.
7.3 The margin is narrowest on open-ended recommendation and planning questions (§3.6) and on Vietnamese-language questions (§3.7).
7.4 Scope. Retrieval quality is necessary and replicable: comparable data access is purchasable by any well-resourced system. This series measures the replicable component because it is the component a public benchmark of standalone questions can measure. Performance conditioned on accumulated knowledge of an individual user is outside its scope.
The MoneyBench protocol is specified here: answers presented under anonymised labels in positions randomised per question, a judge drawn from outside the systems under test, per-question fact verification against live sources, an accuracy veto, and per-question logging of the facts checked. The record carries the gaps listed in §6, the most consequential being the verbatim instructions given to the judge, including the operational definition of usefulness, the dimension that carries the result. Third-party replication requires that text, and it should accompany any release of this report. The question set is not released, because it consists of real user queries and releasing it would expose customer data. That is a deliberate constraint rather than an omission, and it has a consequence worth stating plainly: these specific results cannot be independently verified, and readers are asked to weigh the method rather than take the figures on trust. Once the judge instructions are published, the protocol can be run by a third party on their own question set, including against Ed.
EdWealth builds AI products for personal financial clarity and Financial Fitness. Ed is a research and analysis tool and is not a licensed financial adviser. This report describes internal testing methodology and results and is not a recommendation to buy or sell any security. Panel II figures computed from 375 recorded scorer responses; Verified Evaluation figures from the per-question verification log; Panel I figures from the Panel I analysis report. Adoption and outcome statistics: TD 2026 AI Insights survey (55%, 77%, 18%); Wells Fargo 2026 Money Study (19%, 38%, and the acted-on and outcome shares among AI users); Intuit Credit Karma survey, fielded 7–14 August 2025, published September 2025, n=1,019 US adults (the poor-decision share among those who acted on the advice).
MoneyBench: measuring usefulness and factual accuracy on real money questions. Published by EdWealth Research, August 2026. Judge: Claude (Anthropic). Comparators: GPT-5.6 Sol at Pro effort; Gemini 3.6 Flash, default. Verified Evaluation facts checked against sources as of 23 July 2026.
金錢安穩,財富前行。
你的錢,終於有人打理;你的生活,終於不再匆忙。