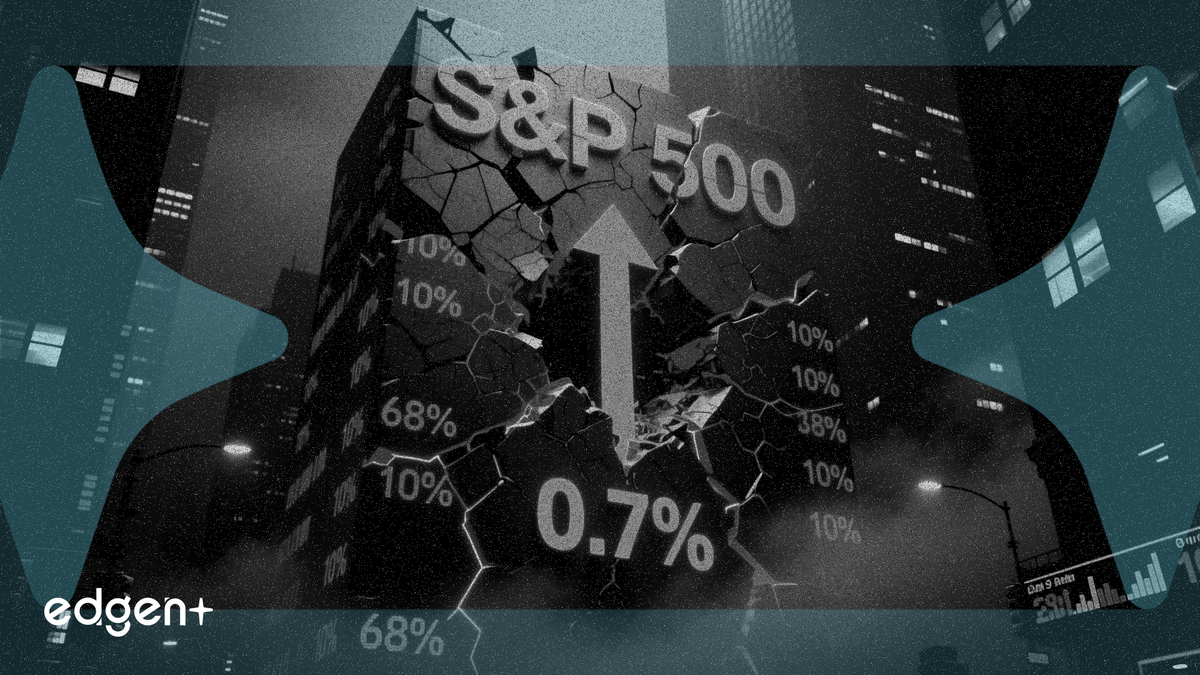
The S&P 500's record-setting run masks a deepening internal correction, with more than two-thirds of its components already down 10% or more from their 52-week highs — a divergence that strategists say leaves the index vulnerable to a broader selloff.
The benchmark fell 56 points, or 0.7%, to 7,554 on Wednesday, snapping a recent winning streak that had pushed it to an all-time high. The Dow Jones Industrial Average dropped 621 points, or 1.2%, to 50,687, while the Nasdaq Composite lost 240 points, or 0.9%, to 26,854. The selloff accelerated after a stronger-than-expected ADP private payrolls report pushed the 10-year US Treasury yield back above 4.5%, reviving concerns about Federal Reserve policy tightening.
"The market is finally pricing in what the internals have been signaling for weeks — that the headline index is being propped up by a narrow group of mega-cap names while the rest of the market is already in correction territory," said Michael Wilson, chief equity strategist at Morgan Stanley. "When the liquidity tide goes out, the divergence between the index and its components tends to close violently."
The divergence is stark. While the S&P 500 trades near record levels, 68% of its constituents have already fallen at least 10% from their 52-week highs, and 19% are down more than 40%, according to data compiled by the article's authors. The semiconductor index (SOX) bore the brunt of Wednesday's selling, plunging 10% as crowded long positions in chip stocks were liquidated — a move analysts attributed to systematic and quant-driven strategies unwinding en masse.
The selloff coincided with three catalysts: a 4-basis-point rise in the 10-year US Treasury yield to 4.49%, the ADP report showing 122,000 private-sector jobs added in May — the strongest in 16 months and above the 117,000 consensus — and escalating US-Iran hostilities that pushed WTI crude above $95 a barrel. The VIX, Wall Street's fear gauge, rose 12% to 29.31, its highest level in three months, as traders scrambled to hedge against further downside.
The Internal Divergence Has Historical Precedent
The current market structure mirrors the period around July 1998, when the Nasdaq was driven by a narrow set of tech leaders before the LTCM crisis and Russian sovereign default triggered a 30% drawdown. Analysts at the research firm behind the analysis draw a direct parallel, noting that the current rally since the Fed paused rate hikes in 2023 has followed a similar trajectory to the 1995-1998 bull run.
The key difference this time is the magnitude of the concentration risk. The top 10 stocks in the S&P 500 now account for more than 35% of the index's market capitalization, a level not seen since the dot-com era. With the market entering a seasonal earnings vacuum — no major tech earnings until Apple's Worldwide Developers Conference next week and the Q2 reporting season in July — near-term catalysts for a rebound remain scarce.
Where the US Government Draws the Line
The analysis estimates that a 10% decline in the S&P 500 from current levels would trigger policy intervention, with the Treasury Department potentially adjusting its General Account (TGA) balance to inject liquidity. A 20% drawdown is considered the maximum tolerance threshold, given that 2026 is a midterm election year and the wealth effect from equities directly impacts consumer spending.
Assuming a marginal propensity to consume of 3% to 5%, a 10% market decline would slow US consumption by roughly 1.6% in the second quarter of 2026, the analysis shows. A 20% crash — entering bear market territory — could push personal consumption expenditures into negative territory for at least one quarter, a politically untenable outcome in an election year.
Inflation and Rates Pose a Dual Threat
The macro backdrop is complicating the outlook. US CPI stood at 3.8% in April, approaching the 4% threshold that historically marks a turning point for equity returns. Since 1934, the S&P 500 has posted an average return of negative 5.4% in the three months following a CPI reading above 4%, according to the analysis. The Nasdaq has underperformed the S&P 500 by a wide margin in those periods, with a 75% probability of trailing the broader index.
The 10-year yield above 4.5% further compresses equity valuations. Historically, when the 10-year exceeds 4.6%, the S&P 500 has delivered an average three-month return of just 2.9% while enduring a maximum drawdown of 5.9%. For the Nasdaq, the average return of 6.6% comes with an 8.8% peak-to-trough decline — a risk-reward profile that strategists say does not justify chasing the rally.
Liquidity Drain From Mega-Cap Financing
A less-discussed headwind is the wave of mega-cap equity financing that is absorbing market liquidity. Alphabet Inc. this week upsized its equity financing package to $84.75 billion, including $18 billion in common stock, $16.75 billion in depositary shares, and a $40 billion at-the-market program. SpaceX is preparing for what would be the largest initial public offering in history, targeting a $75 billion raise at a valuation of $1.8 trillion, with shares priced at $135 each.
With standard lock-up periods of 90 to 180 days, the bulk of the selling pressure from these deals is expected to hit in the third and fourth quarters of 2026, further straining a market already grappling with elevated valuations and rising rates.
The Emerging 'Anti-AI' Risk
A structural risk that remains underappreciated is the growing pushback from small and medium-sized enterprises against AI spending. The ratio of AI investment to revenue generation for US companies has been declining through 2025 and 2026, according to the analysis, as SMEs reduce their AI service purchases in response to disappointing returns on investment.
The potential transmission mechanism is straightforward: lower SME spending on AI services leads to lower revenue for AI vendors, which in turn forces a reduction in capital expenditure, ultimately challenging the market's current pricing paradigm for AI-related stocks. If this dynamic accelerates, it could trigger a reassessment of the entire AI trade that has powered the market's gains over the past 18 months.
For now, the path of least resistance appears lower. With the 10-year yield above 4.5%, CPI approaching 4%, a liquidity drain from mega-cap financings, and an emerging anti-AI spending cycle, the S&P 500's internal divergence may finally be resolved not by the laggards catching up — but by the leaders coming down.
This article is for informational purposes only and does not constitute investment advice.